Drawing Diagrams with Mermaids
Produce beautiful diagrams from text.
Tagged with: tools
Published on and last updated on
An image says more than a thousand words. This old saying is very true when it comes to software development. It is way easier to discuss a topic with multiple people when you can draw an image of the thing you are talking about. Otherwise, everybody will probably have a slightly different understanding of the topic. There are many tools out there that make it easy to quickly draw some boxes and arrows like draw.io, Excalidraw, or Miro. I have used all of those tools and I can recommend them but one thing all of them have in common is that they are graphical tools that require the user to think about distracting stuff like layout or colors when thinking about a problem. As a programmer, my brain is most comfortable with thinking in plain text and several tools out there make it possible to write text that gets turned into beautiful diagrams. In this post, I want to tell you about Mermaid which works well for most of my use-cases but there exist quite a few similar tools like Graphviz or PlantUML which are also quite interesting.
Mermaid describes itself as a “JavaScript based diagramming and charting tool that renders Markdown-inspired text definitions to create and modify diagrams dynamically”. It does an extraordinary job. The syntax of the different diagram types is intuitive and easy to remember. There are many different diagram types like flowcharts, sequence diagrams, class diagrams, state diagrams, and many more. For quick designs, there exists a live editor with share and export functionality. Even platforms like GitHub or Azure DevOps offer support for embedded Mermaid diagrams in Markdown. This makes Mermaid a great choice to document software. I use the Mermaid live editor to quickly sketch out parts of a system and then discuss them with colleagues. These diagrams can then be used to implement the design and also end up in the documentation. Due to the plain text source of those diagrams, it is also possible to quickly change the documentation without having to redraw everything.
As I mentioned at the beginning an image says more than a thousand words so let me show you some diagrams and their source code so you get a better feeling for Mermaid.
The following is a diagram that creates a flowchart for “make it work, make it right, make it fast”. In my opinion, the source code can be understood without looking into the documentation of Mermaid.
graph TD
    A(Develop feature)
    work{Does it work?}
    makeWork[make it work]

    right{Is it right?}
    makeRight[make it right]

    fast{Is it fast enough?}
    makeFast[make it fast]

    done(feature done)

    A --> work
    work -- no --> makeWork
    work -- yes --> right
    makeWork --> work
    right -- no --> makeRight
    makeRight --> right
    right -- yes --> fast
    fast -- no --> makeFast
    makeFast --> fast
    fast -- yes --> done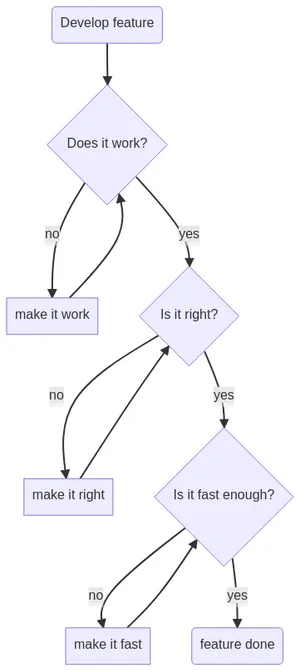
The next diagram is a sequence diagram of a pizza order. This type of diagram demonstrates that not a lot of code is needed to draw a quite complex diagram that would be hard to draw in a graphical tool.
sequenceDiagram
    Me->>Pizza-Place: I'd like to order a pizza
    Pizza-Place->>+Me: Order Confirmation
    Pizza-Place-)+Cook: Make a new pizza
    Cook--)-Pizza-Place: Pizza
    Pizza-Place-)+Delivery Person: Deliver this pizza
    Delivery Person->>Me: Pizza
    Delivery Person--)-Pizza-Place: Pizza delivered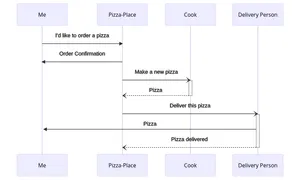
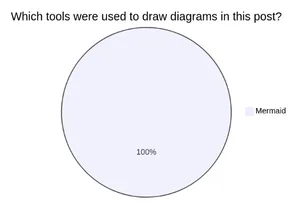
As you can see in the examples Mermaid is a very powerful tool. It allows everyone to quickly draw good-looking diagrams that are easy to maintain and understand. I suggest that you consider it the next time you need a diagram. Here is a final example of a pie chart.
pie title Which tools were used to draw diagrams in this post?
    "Mermaid" : 100